
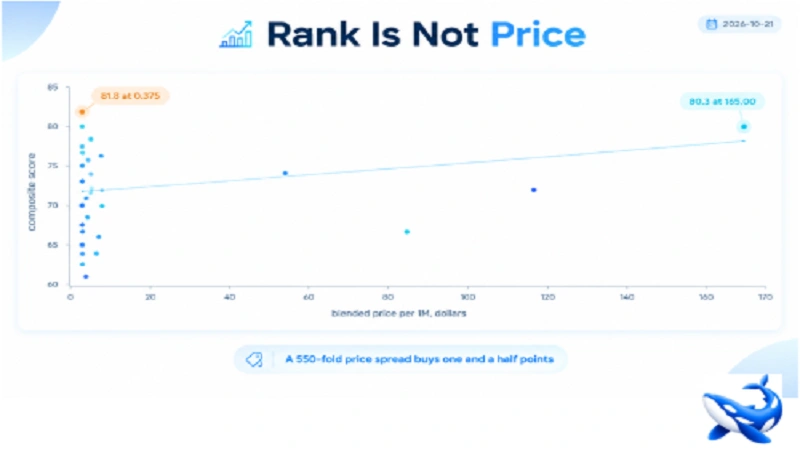
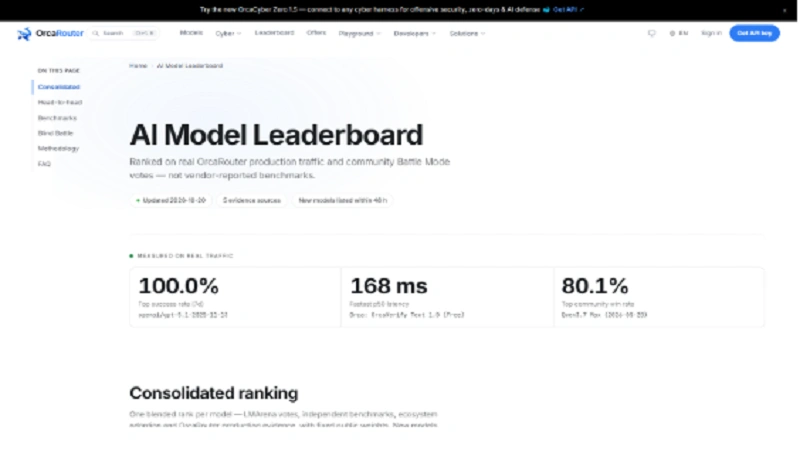
The OrcaRouter AI leaderboard lists twenty-five models with a composite score, and twenty-four of them carry a price [OURS, page data read 2026-10-21].
The cheapest by blended rate — the average of input and output per million tokens — is $0.30 on GPT-6 Luna. The dearest is $165.00 on GPT-5.4 Pro. That is a spread of 550×, across a board whose composite scores run from 61.0 to 84.2.
The two models at the ends of that price range sit 1.5 points apart in rank. One of them is second.
The two ends of the board
Rank 2 — DeepSeek V4.1 Flash. Composite 81.8. Input $0.15, output $0.60, blended $0.375.
Rank 3 — GPT-5.4 Pro. Composite 80.3. Input $60, output $270, blended $165.00.
Fifteen tenths of a point separate them, on a 0-to-100 scale. The cheap one is 440 times cheaper on the blended measure. It also carries an independent intelligence index of 39.5 against the expensive row’s 66.0 [the board aggregates third-party signals and prints them beside the composite].
So the expensive row wins decisively on the raw benchmark and loses narrowly on the composite. Something in the blend is doing heavy lifting in the opposite direction — and the blend’s published weights say what: human preference 40 percent, independent benchmarks 30 percent, production evidence 20 percent, ecosystem adoption 10 percent [OURS].
An independent benchmark is 30 percent of the score. The other 70 percent is not a benchmark at all.
The relationship, measured
Across the twenty-four priced rows, the correlation between composite and blended price is r = 0.419 [OURS arithmetic on the board’s own numbers].
That is a real positive relationship and a weak one. A correlation of 0.42 means price explains about 18 percent of the variance in score — enough that expensive models tend to score higher, far too little to use price as a proxy for capability.
The top ten rows span blended prices from $0.30 to $165.00, a spread of 550×, and their composites run from 68.9 to 84.2 — a gap of 15.3 points. Ten models, sixteen times cheaper at the bottom than the top, scoring within fifteen points of each other.
What the cheap top row is made of
The second-place row deserves its own paragraph because its position is the least intuitive thing on the board.
DeepSeek V4.1 Flash scores 81.8 with an independent intelligence index of 39.5 — lower than every other model in the top ten [OURS page data]. Its composite is carried by the other families: a large ecosystem adoption share and, per the board’s methodology, production evidence from this platform’s own traffic.
So a model with the lowest benchmark score in the top ten ranks second. That is not an error in the board; it is what happens when benchmarks are 30 percent of a composite and adoption plus production evidence are the other 30. A model that everyone uses and that serves reliably scores well even when it scores modestly on tests.
Read the other way, the same fact is a warning. If you are choosing a model on independent benchmark performance, this board is not that ranking — and the model at rank 2 will not be the one your benchmark-driven shortlist picks.
The price column nobody uses
Every row carries input and output prices, and the blended figure is their average. That average is a convenience and it is also a distortion, because the two numbers are not used in equal proportion.
Work out one million tokens of traffic at a 70/30 input/output split on a model with a five-to-one output ratio and the true cost is 0.7 x input plus 0.3 x 5 x input, or about 2.2 times the input rate. The blended figure for that model is 3 times the input rate. The blend overstates a balanced text workload by roughly a quarter, and it understates a generation-heavy one — the error’s size and direction both move with the ratio, which differs by model.
Two examples from the board make the scale clear. GPT-5.4 Pro’s $60/$270 blend is $165, but a million output tokens costs $270 — 64 percent above the blended figure. Gemini 3.8 Flash’s $0.75/$3.75 blend is $2.25, but its output costs $3.75 — 67 percent above. Both are overstated by the blend on the output side; the error’s size varies with the ratio.
That is why the board’s price column is best read as a ranking device rather than a budget. It sorts the board by cost order reliably and it tells you nothing about what your workload will pay.
The rows with no price at all
One of the twenty-five has no price: Nano Banana 2 (Gemini 3.1 Flash Image Preview) at rank 13, composite 66.3 [OURS]. Its row is request-billed elsewhere in the catalogue, and the board’s input/output columns have nothing to put in it.
That row is a reminder that a price column on a leaderboard is a convenience over a heterogeneous catalogue rather than a complete field. Image models, embedding models and speech models do not have a per-million-token pair, and a board that only ranks text models would be narrower than the catalogue it describes.
It also means the 550× figure is a spread over twenty-four rows, not twenty-five, and the missing row’s absence changes the denominator by nothing while changing the interpretation by a little: the board is not a text-only ranking, it is a mixed ranking with a text-shaped price column.
How to use a board with a price column
Four rules.
Read rank and price as independent columns. They correlate at 0.42, which is not enough to substitute one for the other. The two ends of the price range sit 1.5 points apart.
Check the composite’s ingredient mix before quoting a position. Benchmarks are 30 percent of it. A model that ranks second on a blend and low on your own benchmark is not a contradiction — it is a different question being answered.
Never budget from the blended figure. The blend averages input and output; your workload does not. Multiply each side by your own split.
Treat a missing price as a category marker. The board lists models that do not have a per-token pair at all, and their composites are still comparable within their own segment.
A leaderboard compresses capability into one number, and this one adds a price column beside it. The two do not move together, which is exactly what makes putting them side by side useful.
Sourcing note: the twenty-five-row board, the composite scores, the input, output and blended prices, the provisional flags and the published weights are our own page data read on 2026-10-21 [OURS]. The composite aggregates third-party signals including an independent intelligence index and platform production evidence; those underlying values belong to their sources and are not restated as ours. The correlation coefficient, the price-spread calculations and the blended-versus-actual comparisons are our own arithmetic on the board’s published figures. No vendor self-reported numbers are used. All values checked 2026-10-21.
See More: GiveAwaysLookWhatMomFound